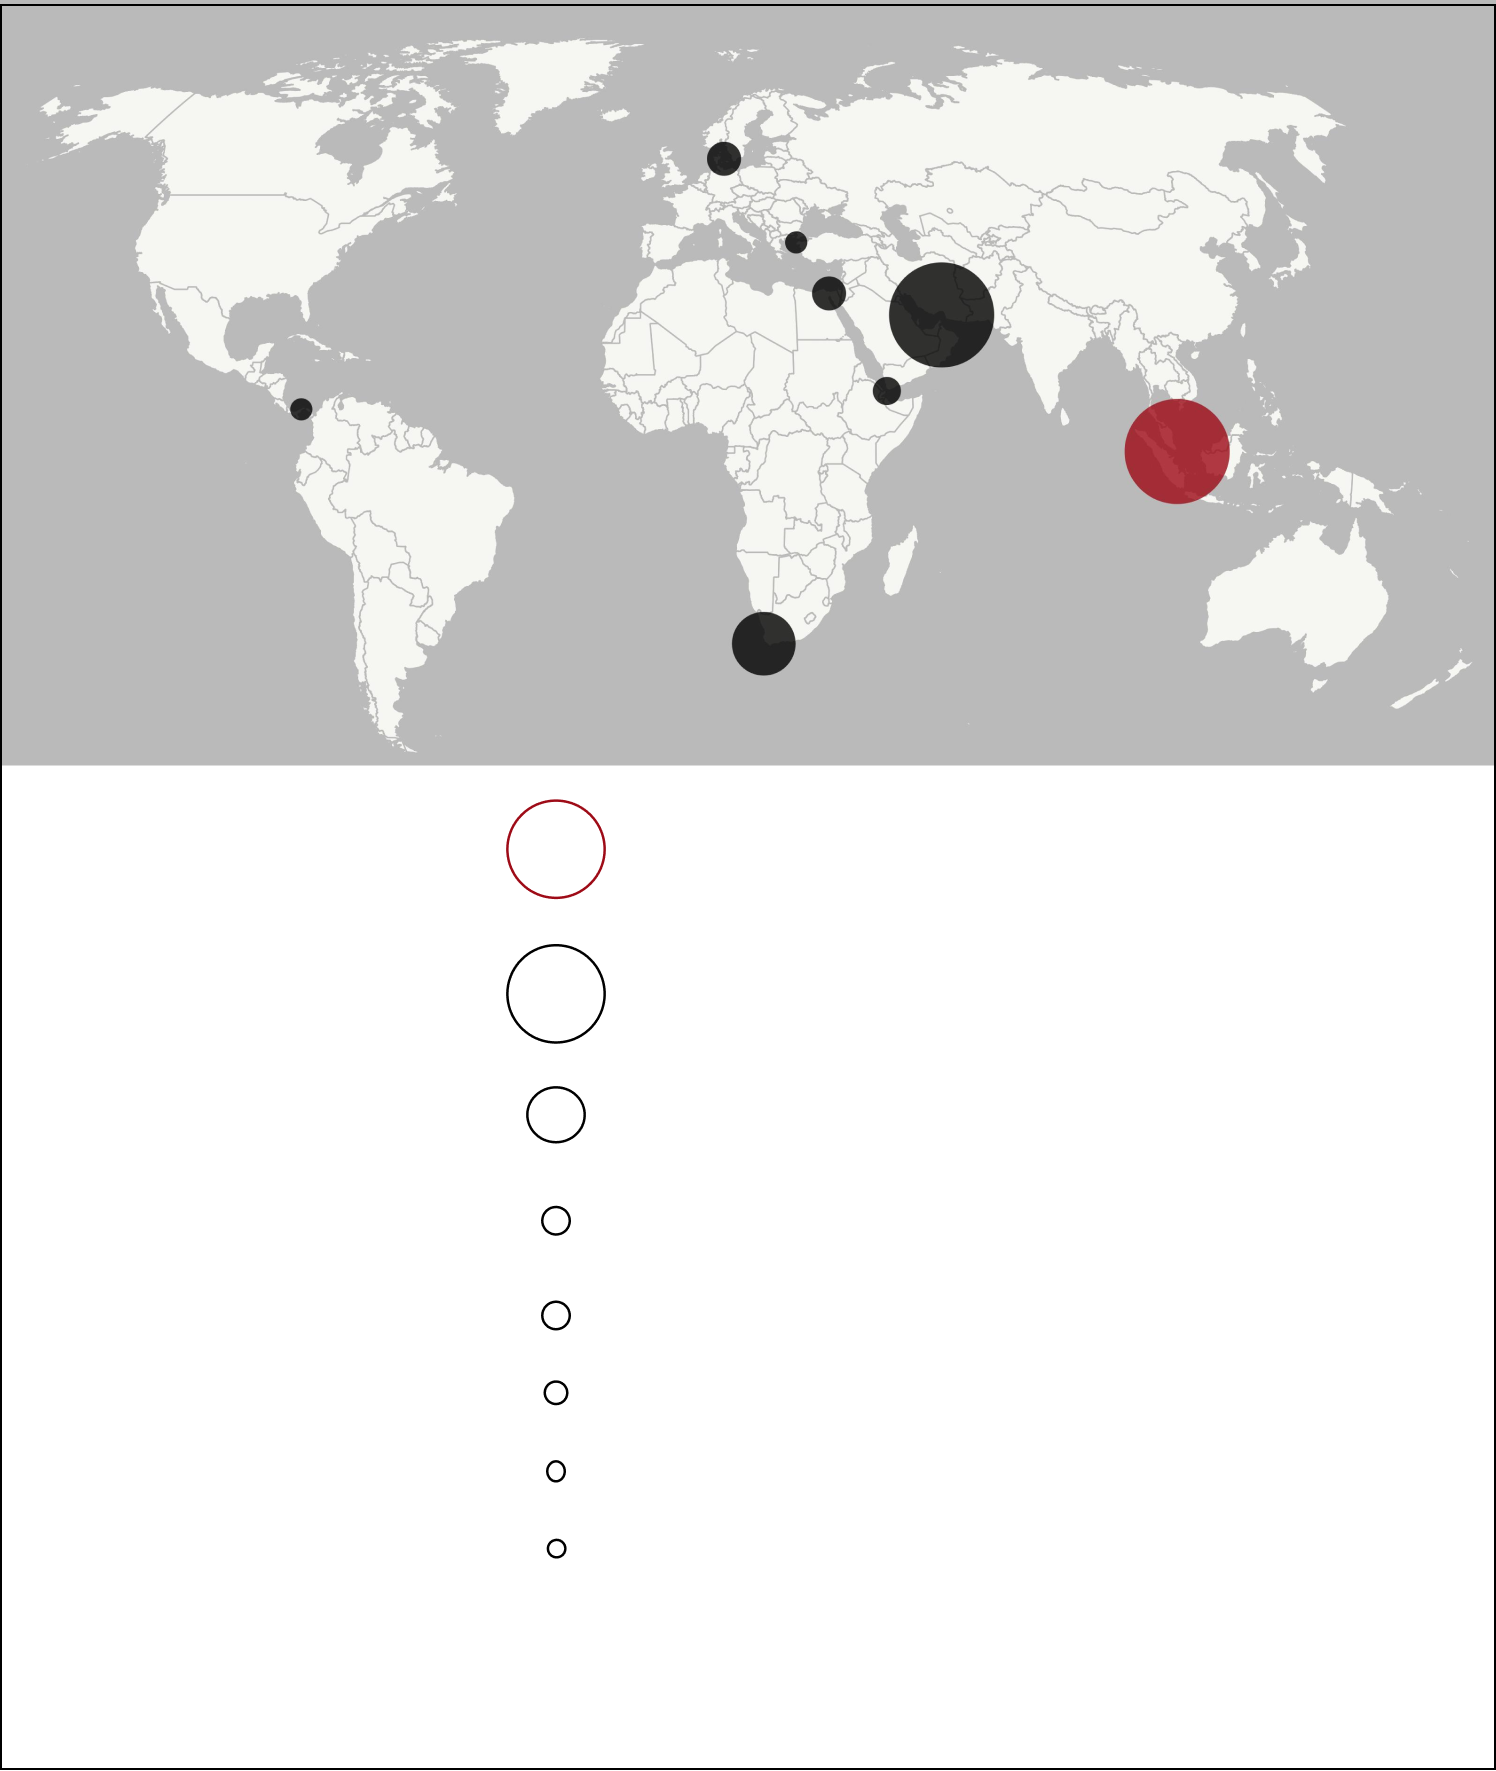
Source: U.S. Energy Information Administration
Strait of Singapore & Malacca
23.2 million barrels
Strait of Hormuz
20.9 million barrels
Cape of Good Hope
9.1 million barrels
Suez Canal & Suez-Mediterranean Pipeline
4.9 million barrels
Danish Straits
4.9 million barrels
Bab el-Mandeb
4.2 million barrels
Turkish Straits
3.7 million barrels
Panama Canal
2.3 million barrels
Oil transported per day*
*Average daily crude oil and petroleum liquids transported in the first half of 2025.
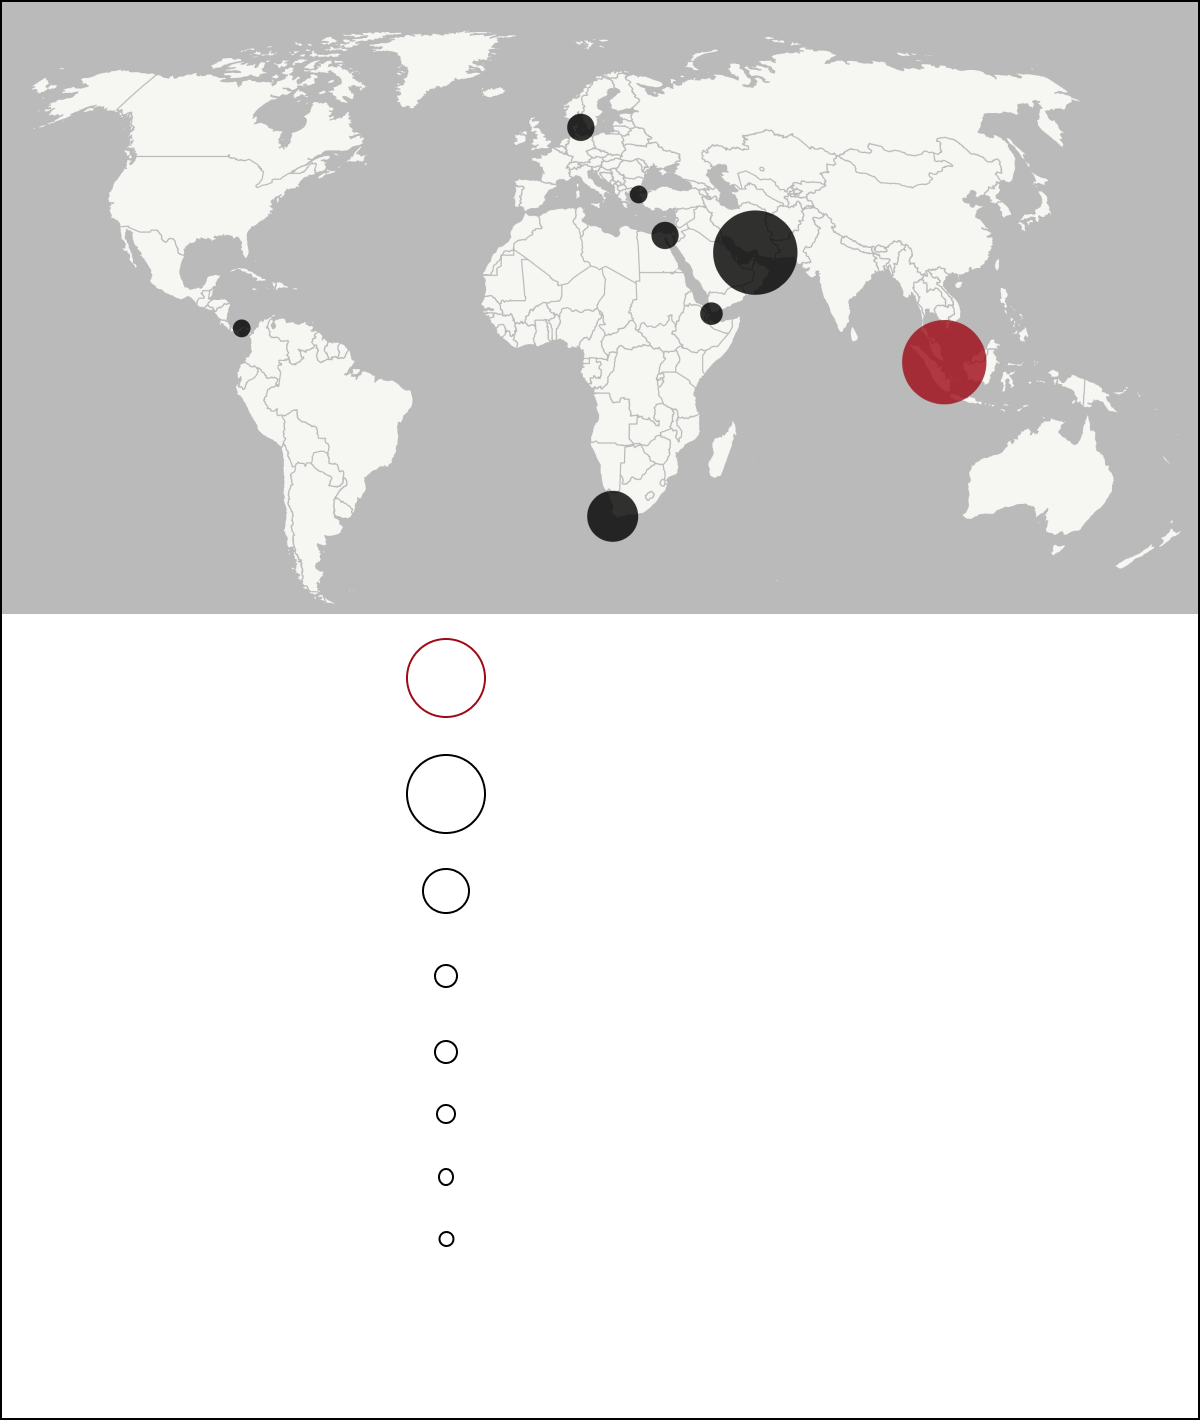
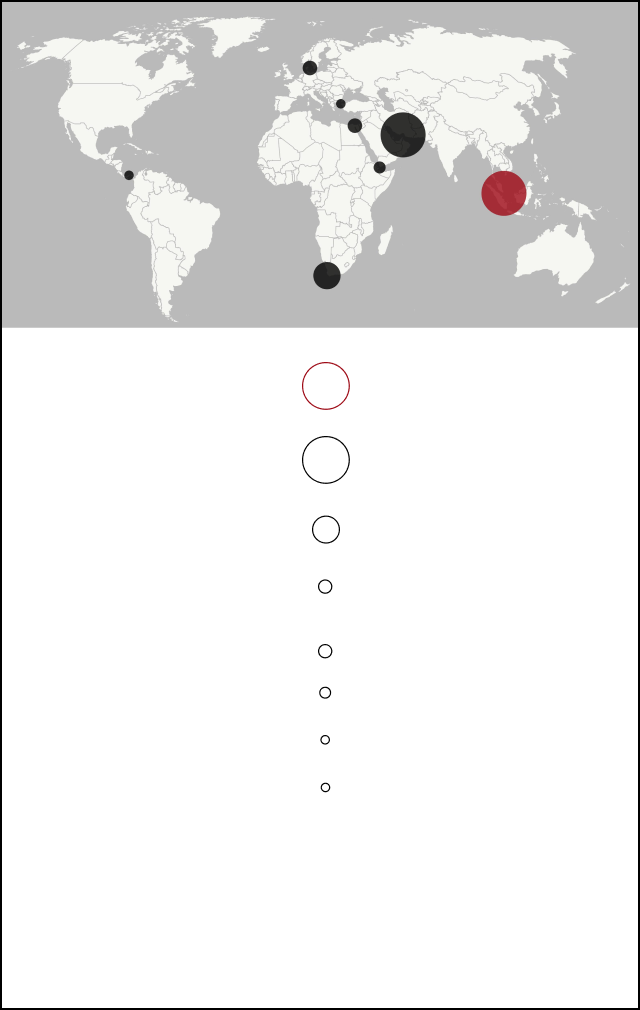
Source: U.S. Energy Information Administration
Strait of Singapore & Malacca
23.2 million barrels
Strait of Hormuz
20.9 million barrels
Cape of Good Hope
9.1 million barrels
Suez Canal & Suez-Mediterranean Pipeline
4.9 million barrels
Danish Straits
4.9 million barrels
4.2 million barrels
Turkish Straits
3.7 million barrels
Panama Canal
2.3 million barrels
Oil transported per day
Oil transported per day*
Bab el-Mandeb
*Average daily crude oil and petroleum liquids transported in the first half of 2025.